on
Down the rabbit hole.
A common programming challenge is to know when to stop. The biggest mistakes I’ve seen, and been guilty of myself, is trying to be too-smart. Or over-engineer something as it’s called in professional speak.
I’ve been awe-struck in recent weeks with what you can do with d3. Take a look at some of Mike Bostock’s examples and the first thing that came to my mind was: “WTF – I have to try some this!”
Stock standard line and bar chart get quite boring when you have a library like this at your disposal. It’s much more interesting to tackle relationship or hierarchy diagrams. The chart of accounts is straight forward and can be displayed with a number of stock standard tree-diagrams.
The status-flow diagram is a bit more challenging because of the many-to-many relationships. You don’t have a predefined image of how you want it to look because of the unpredictability of the relationships. A many-to-many diagram doesn’t start with a root and end with a leaf like a tree-diagram. It can go anywhere.
My circular diagram is a reasonable attempt, but then I though about drag-and-drop addition. So the the user can adjust the diagram to be more relevant. Adding the drag-and-drop however led me to explore what’s called d3-force.
Instead of drawing the connecting lines and then the circles, this allows you to just define the relationship and let the library do the rest:
this.sim = d3.forceSimulation()
  .force("charge", d3.forceManyBody().strength(-200))
  .force("link", d3.forceLink().id(d => {
    return (<any>d).id;
  }).distance(Math.min(width, height) / 2).strength(1))
  .force("x", d3.forceX(width / 2))
  .force("y", d3.forceY(height / 2))
  .on("tick", this.ticked);
this.sim.nodes(nodes);
(<any>this.sim.force("link")).links(links);
That’s it! – Except that you need additional code to draw the lines and circles, so the code isn’t much shorter. But the main thing is that you let the library decide how to draw the relationship after defining some dimensional parameters and passing in the data.
And this is how it looks:
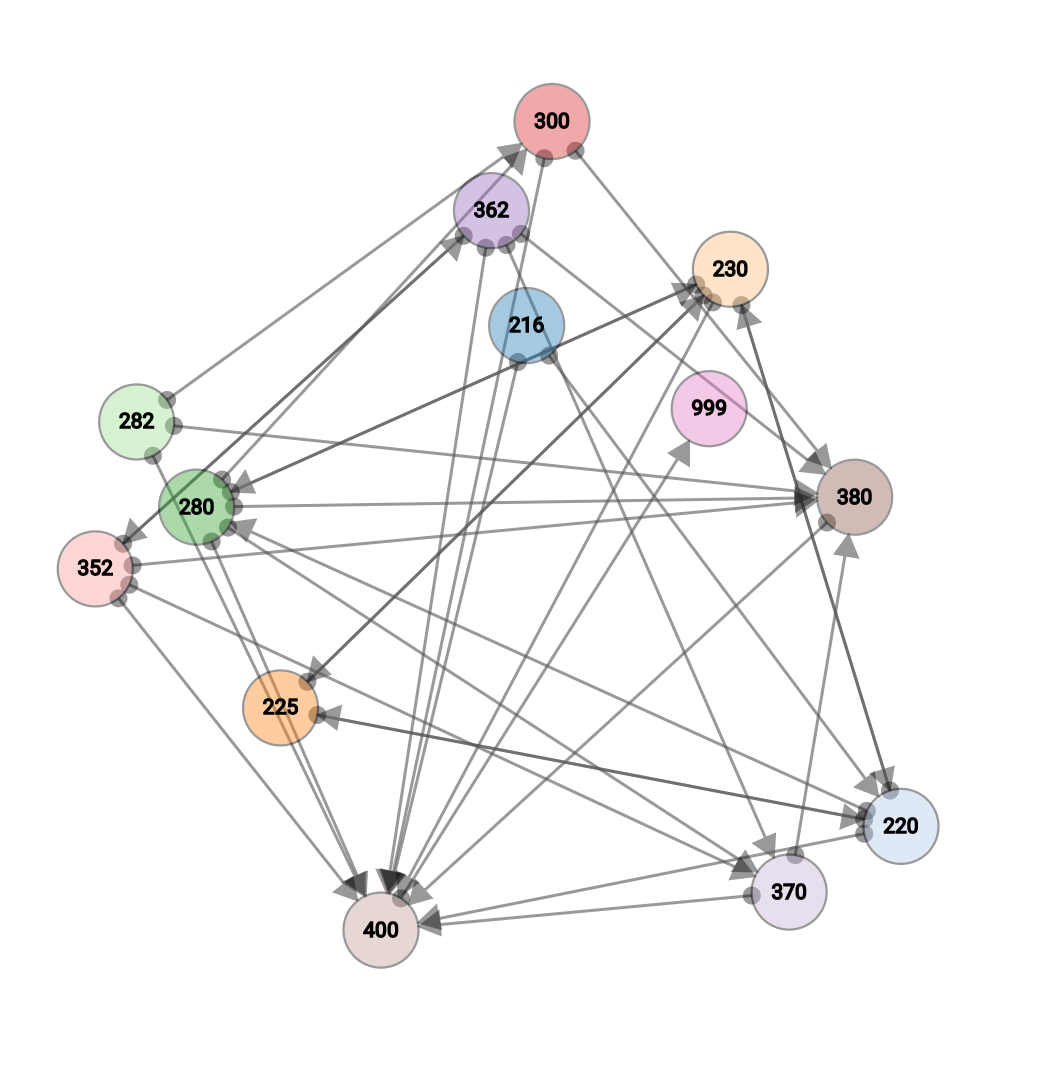
It’s a nice picture. But is it useful?
The upside is that as the programmer I’m not deciding the placement of the circles and lines, only their attributes, like colour and dimensions. This again emphasise a design principle of d3, which is to program it what to do, not how to do it. In this case I give d3 a status list and flow, canvas dimension and attributes of the lines and circles. And finally ask it to simulate a force-link diagram.
Perhaps the main point about this is that once you’ve climbed the mountainous learning curve, the coding is a breeze.