on
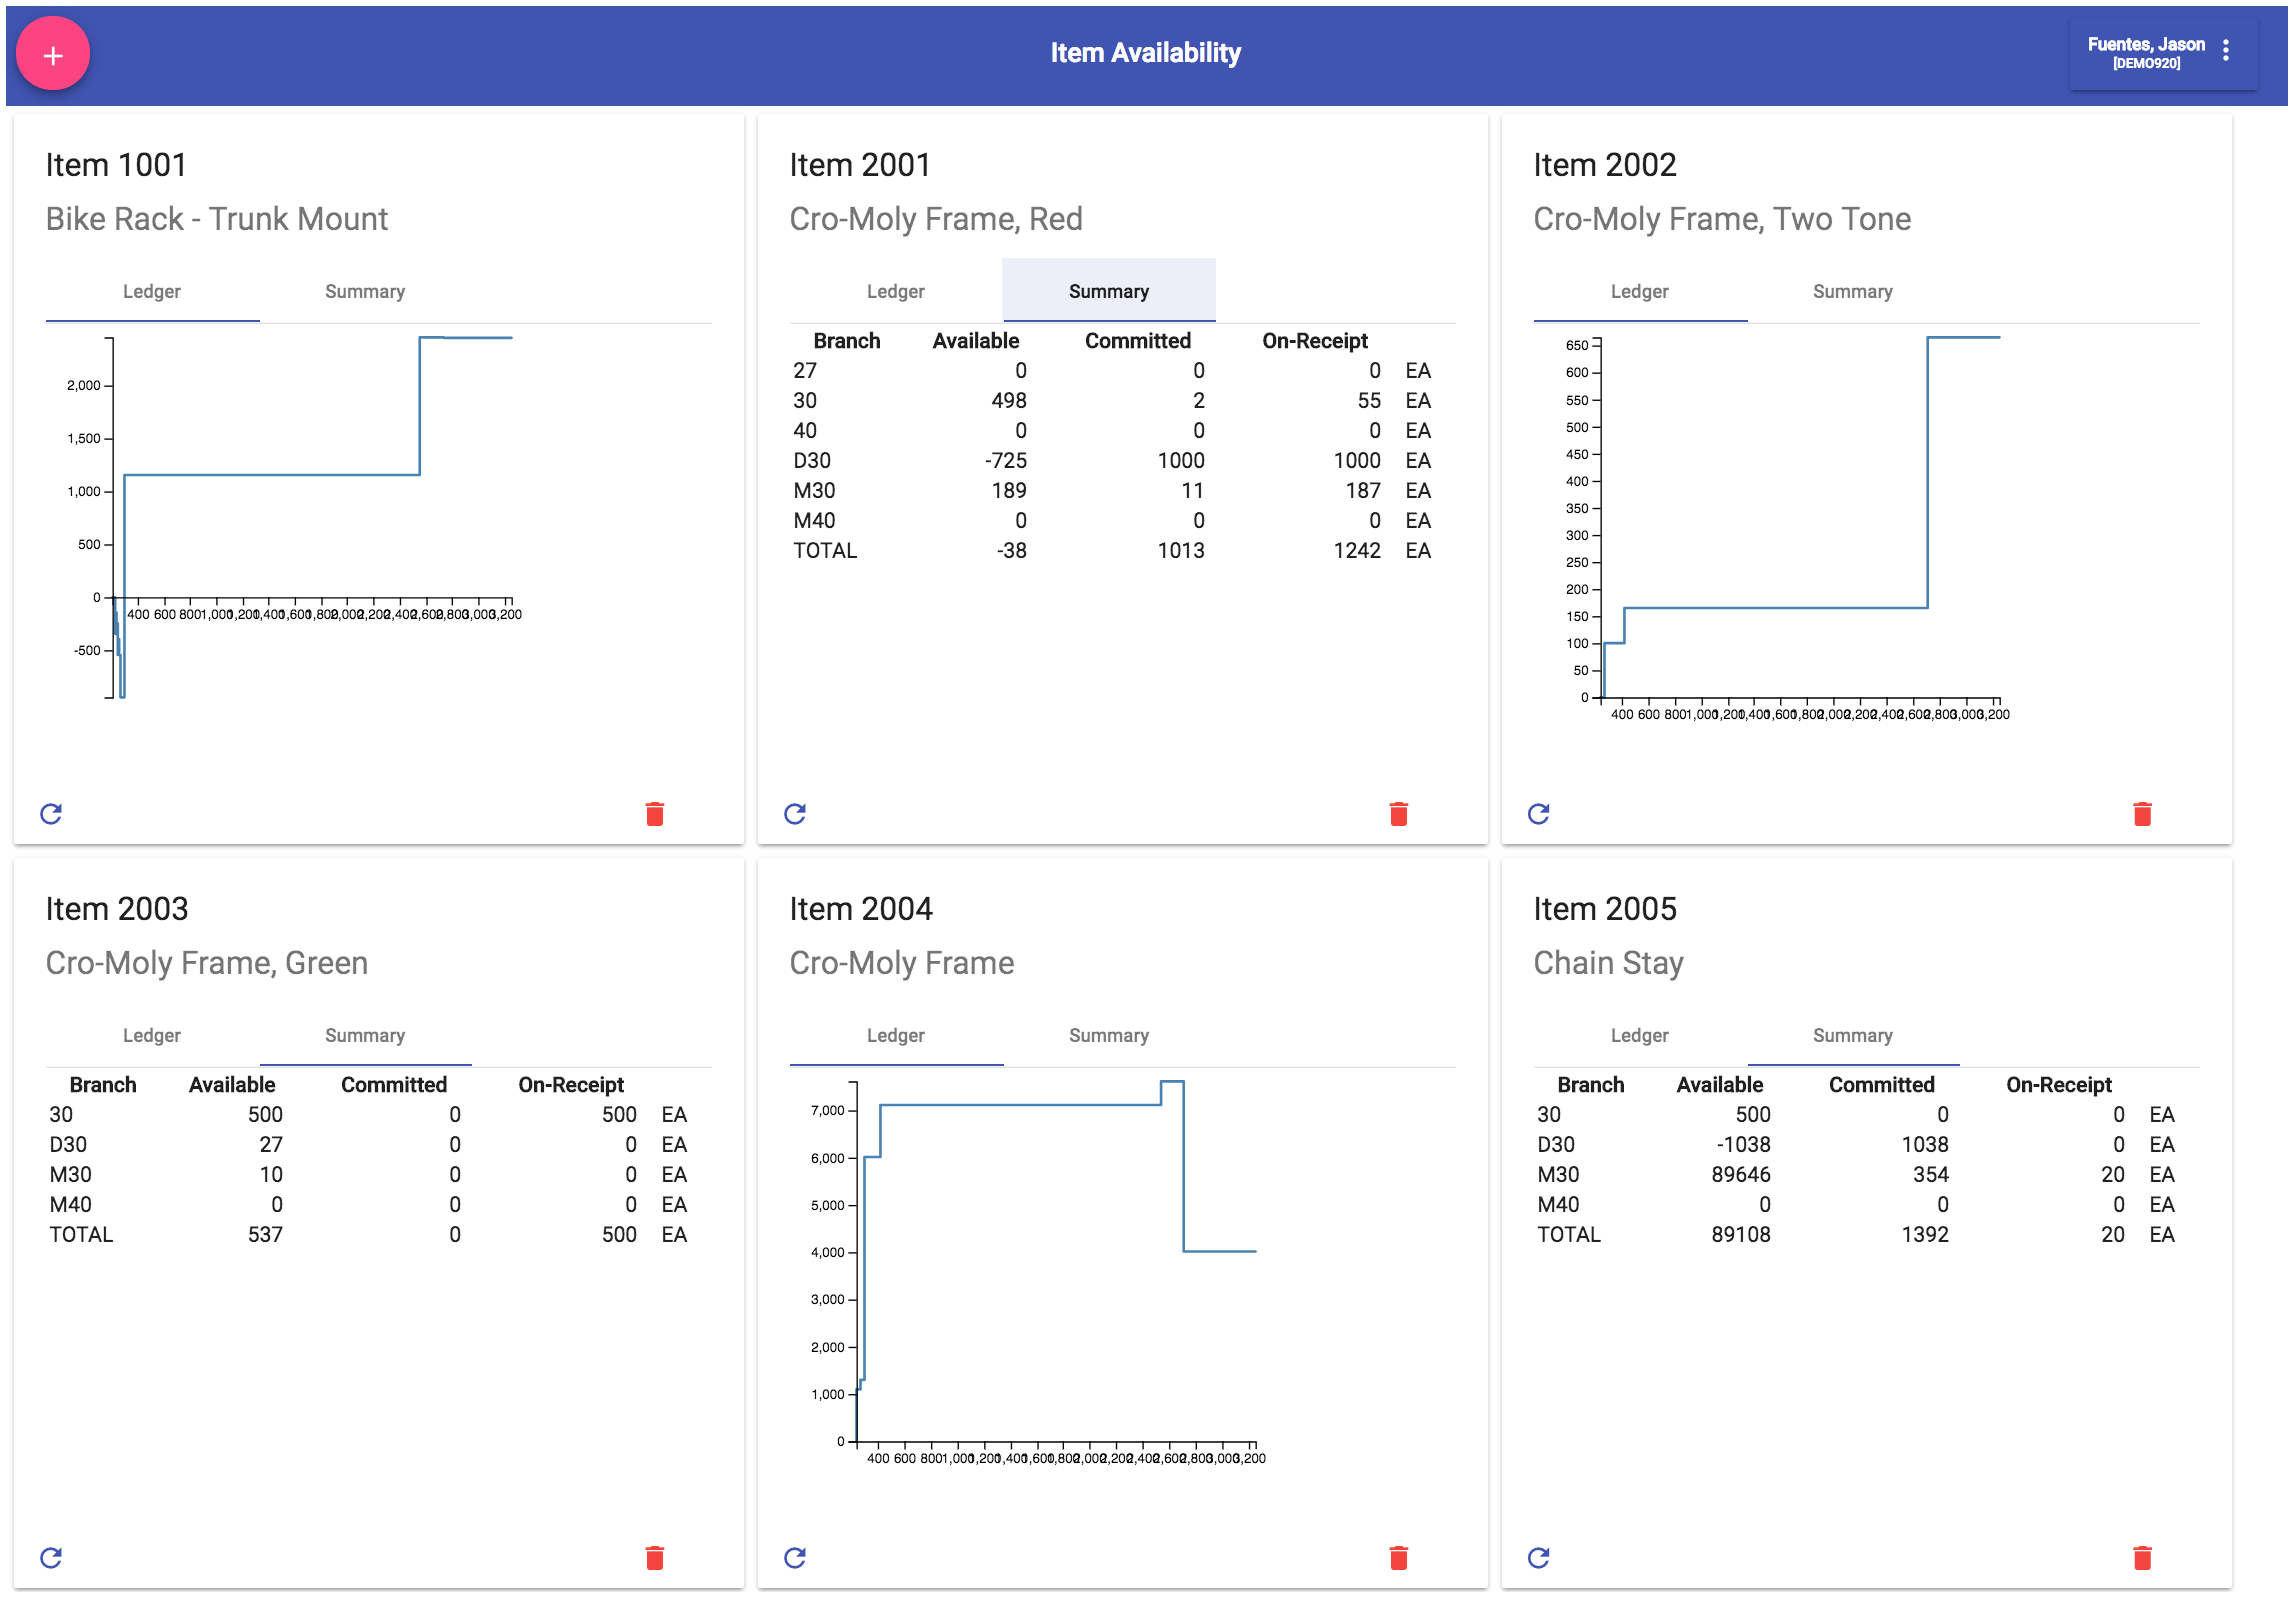
Item availability - part 5
Part five is now available on Github and forked on Stackblitz.
This is the final part of the target I set myself a week ago, to build an item-availability web-app.
And the last piece of code was to chart the item-ledger.component.
        const data = l
          .filter(r => r.item === this.item)
          .sort((a, b) => new Date(a.transaction).getTime() > new Date(b.transaction).getTime() ? -1 : 1)
          .reduce((ac, next) => {
            const days = Math.abs(moment(next.transaction).diff(moment.now(), 'days'));
            const i = ac.find(r => r.days === days);
            i ? i.delta += next.quantity : ac.push({ days, delta: next.quantity });
            return ac;
          }, []);
        data.reduce((bal, next) => {
          next.balance = bal;
          return bal += next.delta;
        }, 0);

        d3.select(`.chart-${this.item} svg`).remove();

        const svg = d3.select(`.chart-${this.item}`)
          .append('svg')
          .attr('width', width + margin.left + margin.right)
          .attr('height', height + margin.top + margin.bottom);

        const x = d3.scaleLinear()
          .domain(d3.extent(data, d => d.days))
          .rangeRound([margin.left, width - margin.right]);

        const y = d3.scaleLinear()
          .domain(d3.extent(data, d => d.balance))
          .range([height - margin.bottom, margin.top]);

        const line = d3.line<{ days; balance }>()
          .curve(d3.curveStepAfter)
          .x(d => x(d.days))
          .y(d => y(d.balance));

        svg.append('path')
          .datum(data)
          .attr('fill', 'none')
          .attr('stroke', 'steelblue')
          .attr('stroke-linejoin', 'round')
          .attr('stroke-linecap', 'round')
          .attr('stroke-width', 2)
          .attr('d', line);

        svg.append('g')
          .attr('transform', `translate(0,${y(0)})`)
          .call(d3.axisBottom(x));

        svg.append('g')
          .attr('transform', `translate(${margin.left},0)`)
          .call(d3.axisLeft(y));
You can easily get lost in Mike’s magic world of visualisation and after spending few hours there I went back to basic and decided on a simple step-chart.
One thing I’ve learned about presenting business data is that people are more interested in trend than actuals. Which makes sense when you think about it. It’s important to know your bank balance, but there is more value in knowing how it’s been trending in the last six month. The actuals tells where you are but trend indicates where you are going.
With this in mind, I decided to show the ledger as a zero-based movement from now to however many days back the ledger-inquiry response had. I’m a bit at a disadvantage because the only data I have i’s JDE’s demo database so this needs to be viewed objectively.
The first part of the code builds the data we want to chart from the ledger app-state variable. We then build x and y axis and the line object and finally draw, or append them with the d3 library on the svg canvas.
D3’s programming logic is a bit of head-spinner but immensely powerful with a certain elegance to it. The only limitation is your imagination.