on
Down the rabbit hole again
I’ve only tiptoed around Mike Bostock’s gallery. It’s a lot to take in and uses programming logic that requires you to suspend everything you learned in order to grasp the concept. It reminded me of my first lesson in quantum physics back in Uni when the teacher introduced it by telling us that everything we’ve learned so far in classic physics and chemistry is wrong – so forget it!
I remember getting quite upset because chemistry in particular was logical. You have atoms with different properties that allow them to assemble into molecules – the universe is just a gigantic atomic puzzle game.
It was not until decades later when I picked up some popular science books about quantum physics that I realised how right my teacher was. It was a good lesson in appreciating how the familiar and comfortable can be counterproductive.
But back to D3. I’ve already played with different types of hierarcies and decided to have a go at an interactive one. I picked the HR org chart as as a source and this is how it looks with the standalone data:
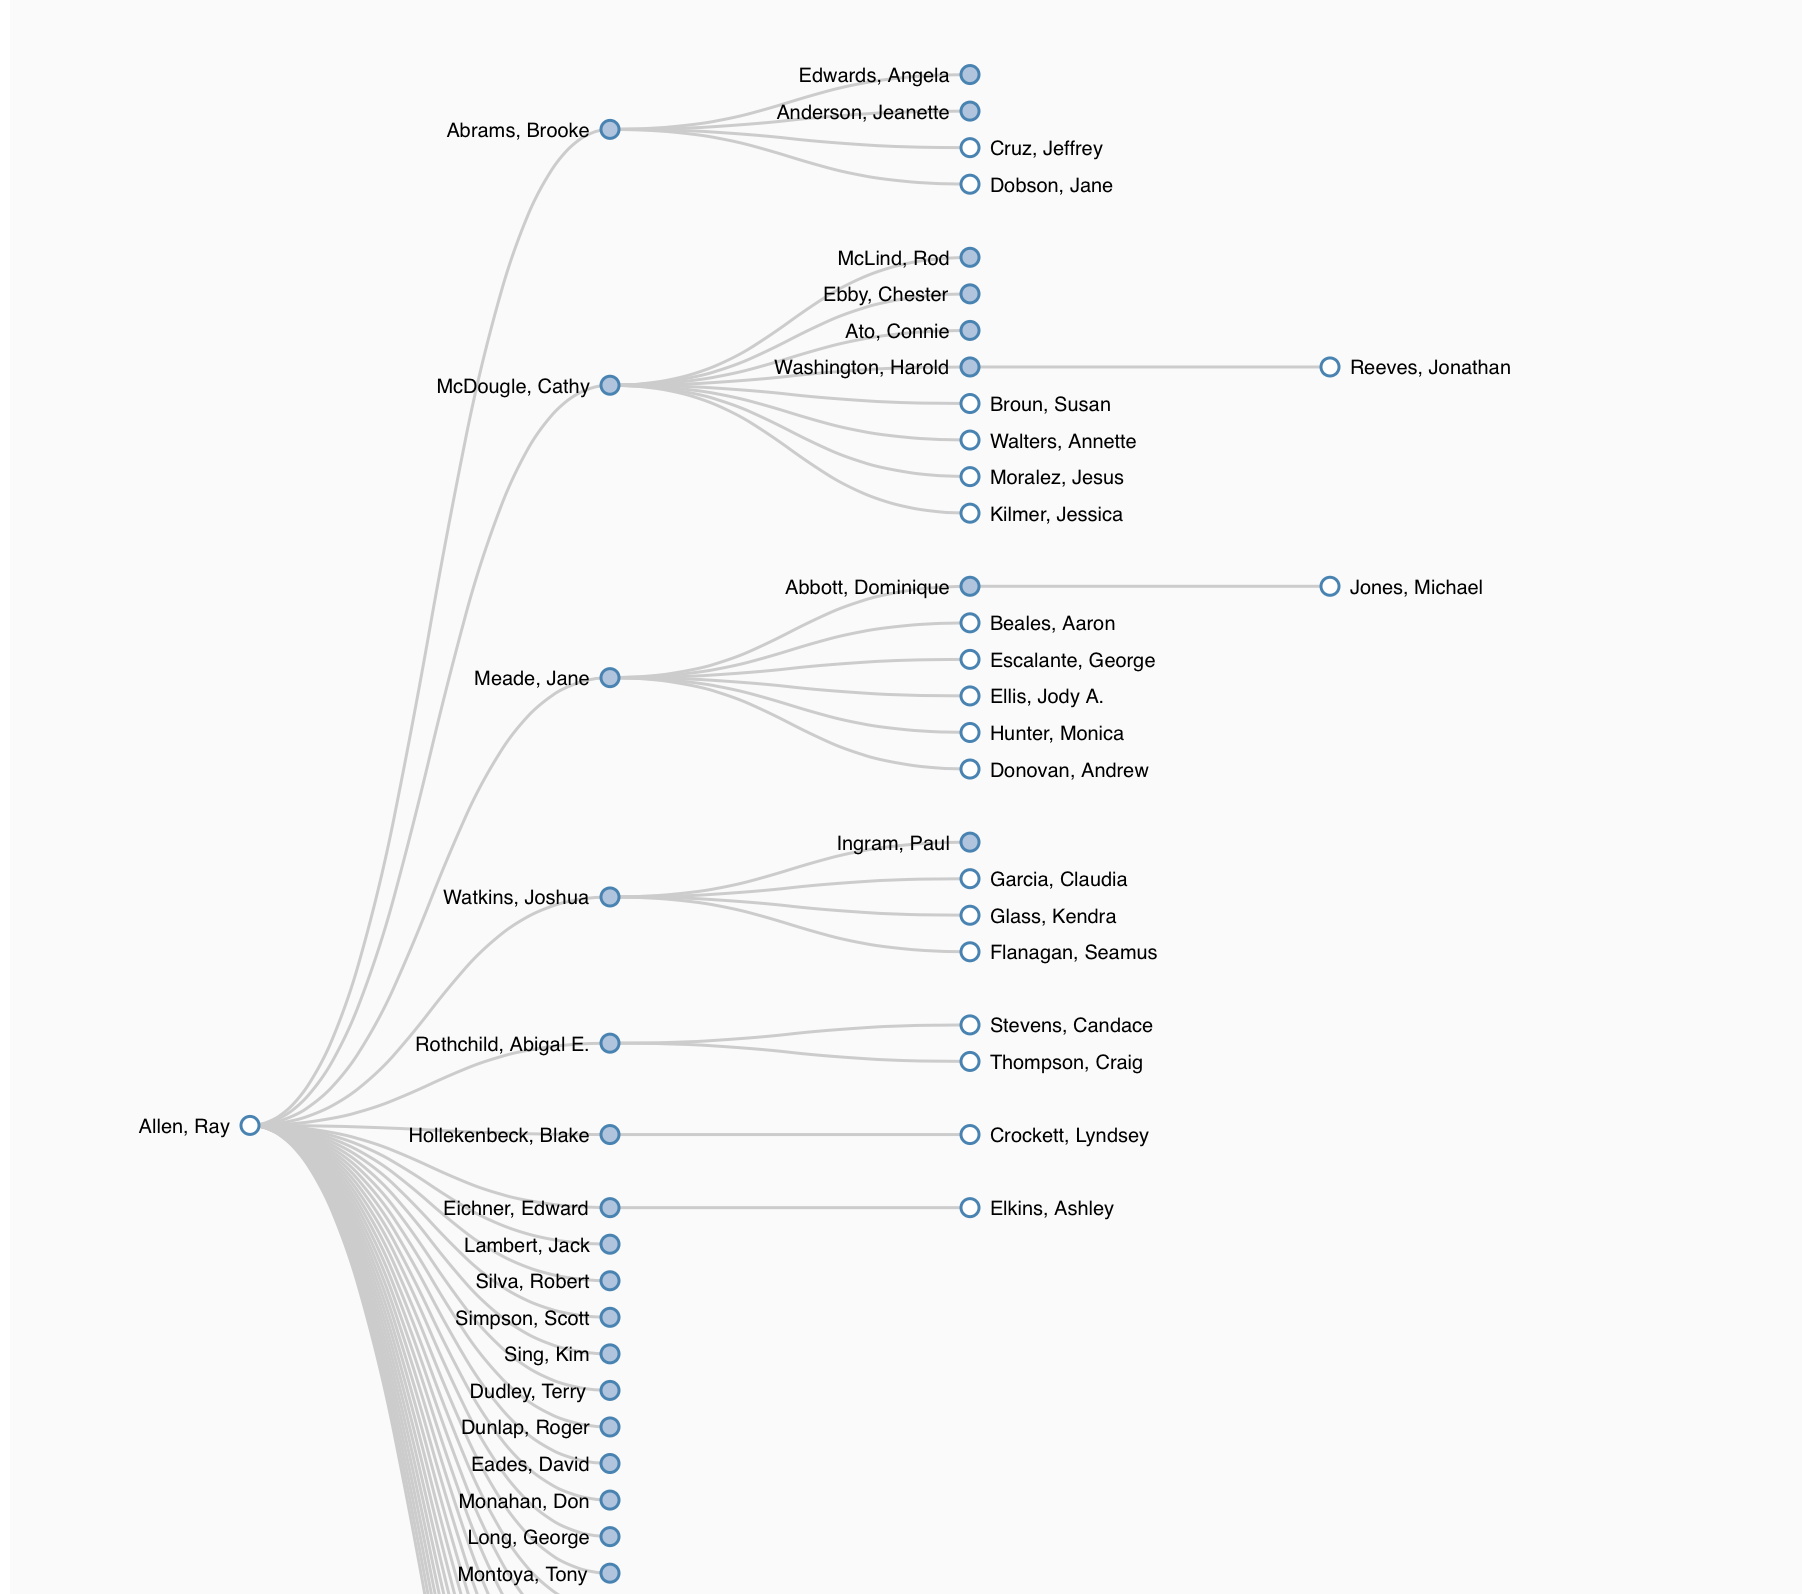
But a snapshot doesn’t give this due credit, so I deployed the sample app on github.
Click here and select the Demo button on the login prompt. You also need to be running an up to date browser, IE for example does not run this without some extensive polyfills as they are called.
What impresses me the most is that this runs entirely in the browser and the way it uses animation to transit the diagram from one state to another. D3 makes this look easy by just asking for the start state, end state and how long it should take. Or as the philosophy goes, let D3 know what you want to draw, provide it with the data to base it on and it will take care of the rest.